A falling credit balance does not establish a lower borrowing rate
No. A decline in aggregate revolving credit does not, by itself, show that borrowing became cheaper or that your own APR fell. The outstanding balance is a dollar amount; an interest rate measures a different feature of borrowing. The Federal Reserve reports those measures separately. Reading one as proof of the other would go beyond what the data establish.
The G.19 covers consumer borrowing for personal purposes, excluding loans secured by real estate. Credit-card loans make up most, but not all, of its revolving-credit category. The methodology also includes arrangements such as prearranged overdraft plans. Its revolving total is therefore neither one person’s card balance nor a measure of that person’s borrowing terms. The figures alone do not identify why August’s aggregate balance declined.
The October 7 release displays seasonally adjusted revolving balances of $1,357.2 billion for July and $1,352.4 billion for August. An independent illustration using those rounded levels gives a $4.8 billion decline: (1,352.4 − 1,357.2) ÷ 1,357.2 × 100 ≈ −0.353669% for the month. Multiplying by 12 gives approximately −4.244032%, which rounds to −4.2% at one decimal place. That matches the displayed annual rate at that precision, but it does not reproduce the Fed’s official calculation: the Fed uses unrounded data and excludes series-break effects. This illustration makes no finding about the cause of the decline.
What the October 7 release says about August
This is a historical reading of the G.19 release dated October 7, 2026. Its latest observation month is August 2026, not October. In the seasonally adjusted table, August is marked preliminary, while June and July are marked revised. The methodology describes revisions to monthly estimates when benchmark data become available, so the release date and the observation date both matter.
- Total consumer credit: +1.9% at a simple annual rate.
- Revolving credit: −4.2% at a simple annual rate.
- Nonrevolving credit: +4.1% at a simple annual rate.
Those three rates describe changes in amounts of credit outstanding, not interest rates charged to borrowers. Total credit increased even though its revolving component decreased. The figures describe August as reported in that dated release; they are not a claim about current October borrowing conditions.
Turn one month’s change into a simple annual rate
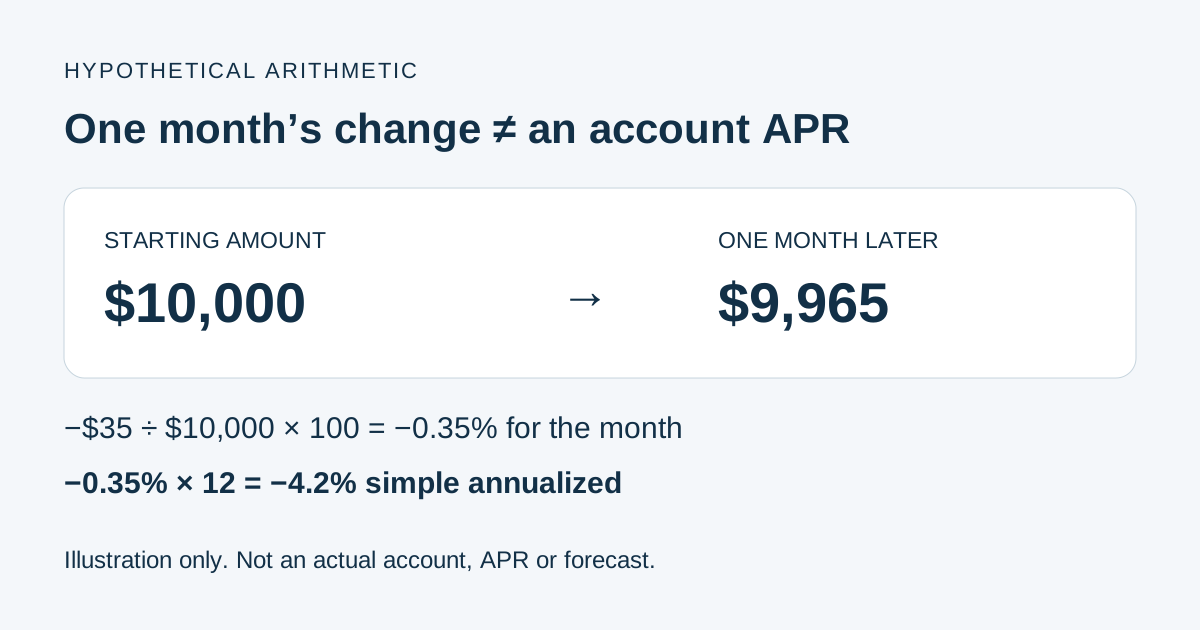
Consider an explicitly fictional amount that falls from $10,000 to $9,965 in one month. The dollar decline is $35. Dividing −$35 by the starting $10,000 gives −0.0035, or −0.35% for that month. Multiplying −0.35% by 12 gives a simple annualized rate of −4.2%. The amount did not fall by $420 that month. The annualized number expresses the one-month pace on an annual scale; it is not an account APR or a prediction of the next twelve months.
Compounding answers a different hypothetical question. If the amount fell by exactly 0.35% in each of twelve consecutive months, the cumulative change would be [(1 − 0.0035)^12 − 1] × 100 ≈ −4.120086%, or −4.12% rounded to two decimal places. Each month’s assumed decline applies to a smaller amount. That is why the compounded result differs from the −4.2% simple annualized rate. Neither example says what will happen next.
The fictional example illustrates arithmetic only. For the actual G.19 growth series, the Fed calculates period growth using the flow of credit relative to the previous period’s level, works from unrounded data, and adjusts for breaks in the series. A subtraction of the published rounded balances is not an exact reconstruction of those inputs or adjustments.
The two credit-card interest measures answer different questions
The separate Terms of Credit table is not seasonally adjusted. Its August 2026 credit-card figures are 21.19% for all accounts and 22.36% for accounts assessed interest. These are aggregate measures from reporting commercial banks, not quoted offers or a statement of any individual’s APR. They describe August, not a current October rate.
- All accounts: the methodology averages the reporting banks’ purchase APR measures using account counts as weights. It includes accounts regardless of how they are used, including whether they incurred finance charges.
- Accounts assessed interest: release footnote 5 describes an annualized ratio of total finance charges to the total average daily balances against which those charges were assessed, excluding accounts with no finance charges. The methodology describes weighting the banks’ annual finance rates by balances carrying finance charges. This differs from an account-count-weighted average of stated APRs.
A deliberately simplified, fictional example isolates the effect of weighting. Suppose three accounts have rates of 10%, 20% and 30%, with balances of $1,000, $100 and $100. Giving each account equal weight produces (10% + 20% + 30%) ÷ 3 = 20%. Weighting those same assumed rates by balances gives [($1,000 × 0.10) + ($100 × 0.20) + ($100 × 0.30)] ÷ $1,200 = ($100 + $20 + $30) ÷ $1,200 = 0.125, or 12.5%. The $150 numerator is a rate-weighted arithmetic amount, not a statement of actual finance charges. This example demonstrates weighting alone; it does not assume any account was assessed interest or reproduce the Fed’s assessed-interest measure.
The 21.19% and 22.36% figures differ in both the accounts included and the calculation used. The fictional example is not an explanation for the actual gap. An applicable APR and finance charges billed are also distinct: an account can be included in the all-accounts average even when it incurs no finance charges. Neither national measure establishes that your own applicable APR changed.
Choose evidence that answers your own question
For a personal-account question, a national total is context rather than account-level evidence. The following is an original reading checklist, not a Federal Reserve recommendation or a formula for reconstructing the Fed’s statistics.
- Identify the applicable APR and the transaction or balance category in the account’s own terms and statement. Keep that rate separate from the amount borrowed.
- Read the charges shown on the statement and the period they cover separately from the stated APR. Do not treat the presence or absence of a charge as proof that the applicable APR changed.
- When checking for a change, compare the account’s own terms and statements across the relevant periods. Do not substitute the national revolving-credit growth rate or either G.19 average for those records.
Sources and further reading
Sources checked October 22, 2026.
- Federal Reserve G.19 October 7, 2026 releaseReleased October 7, 2026; August data.
- Federal Reserve G.19 methodologyMethodology checked October 22, 2026.